Welcome to the quarter 1, 2025 Dimensional investment update from Betterment Wealth. This update is for our clients with funds invested in a Dimensional Wealth portfolio (Core, Core Plus or Sustainability). These quarterly updates provide insights into the equity returns of the portfolios for the previous quarter.
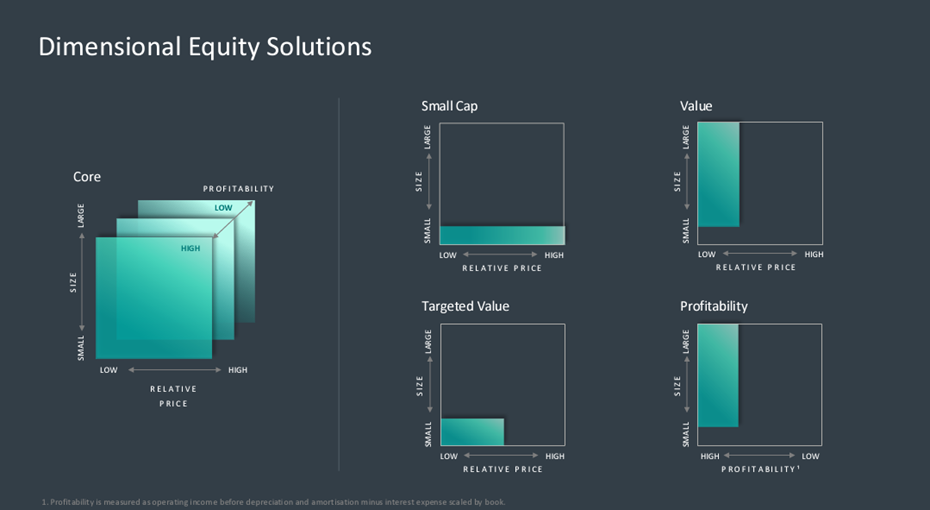
Dimensional tilt toward securities with higher expected returns. As per the image below, equity allocations focus on size, value, and profitability.
Dimensional produced the following series of charts as part of their quarter 1, 2025 market review; therefore, Betterment Wealth is not accountable for the accuracy of the data.
Past performance is not a guide to future returns. The value of your investment can go down as well as up and you may not get back all that you invested.
The CBOE Volatility Index (VIX) “The Fear Index”
The first quarter of 2025 hasn’t been without a lot of noise in the investment world, most of which has stemmed from the words of President Trump, resulting in the 5th worst 2-day fall in the S&P500 since 1940. At times like these, we stay true to our investment principles, continue tuning out the noise, and focus on the long term.
The CBOE (Chicago Board Options Exchange) Voliatility Index chart below is a popular measure of the stock market’s expectation of volatility based on the S&P 500 index and is often referred to as the “Fear Index”. The VIX index helps to put market conditions into context. It’s recent peak was significantly below the peak of the Global Financial Crisis in 2008 and the beginning of the Covid-19 pandemic in 2020. As of today (28th April 2025) the index is 50% lower than its peak 3 weeks ago.
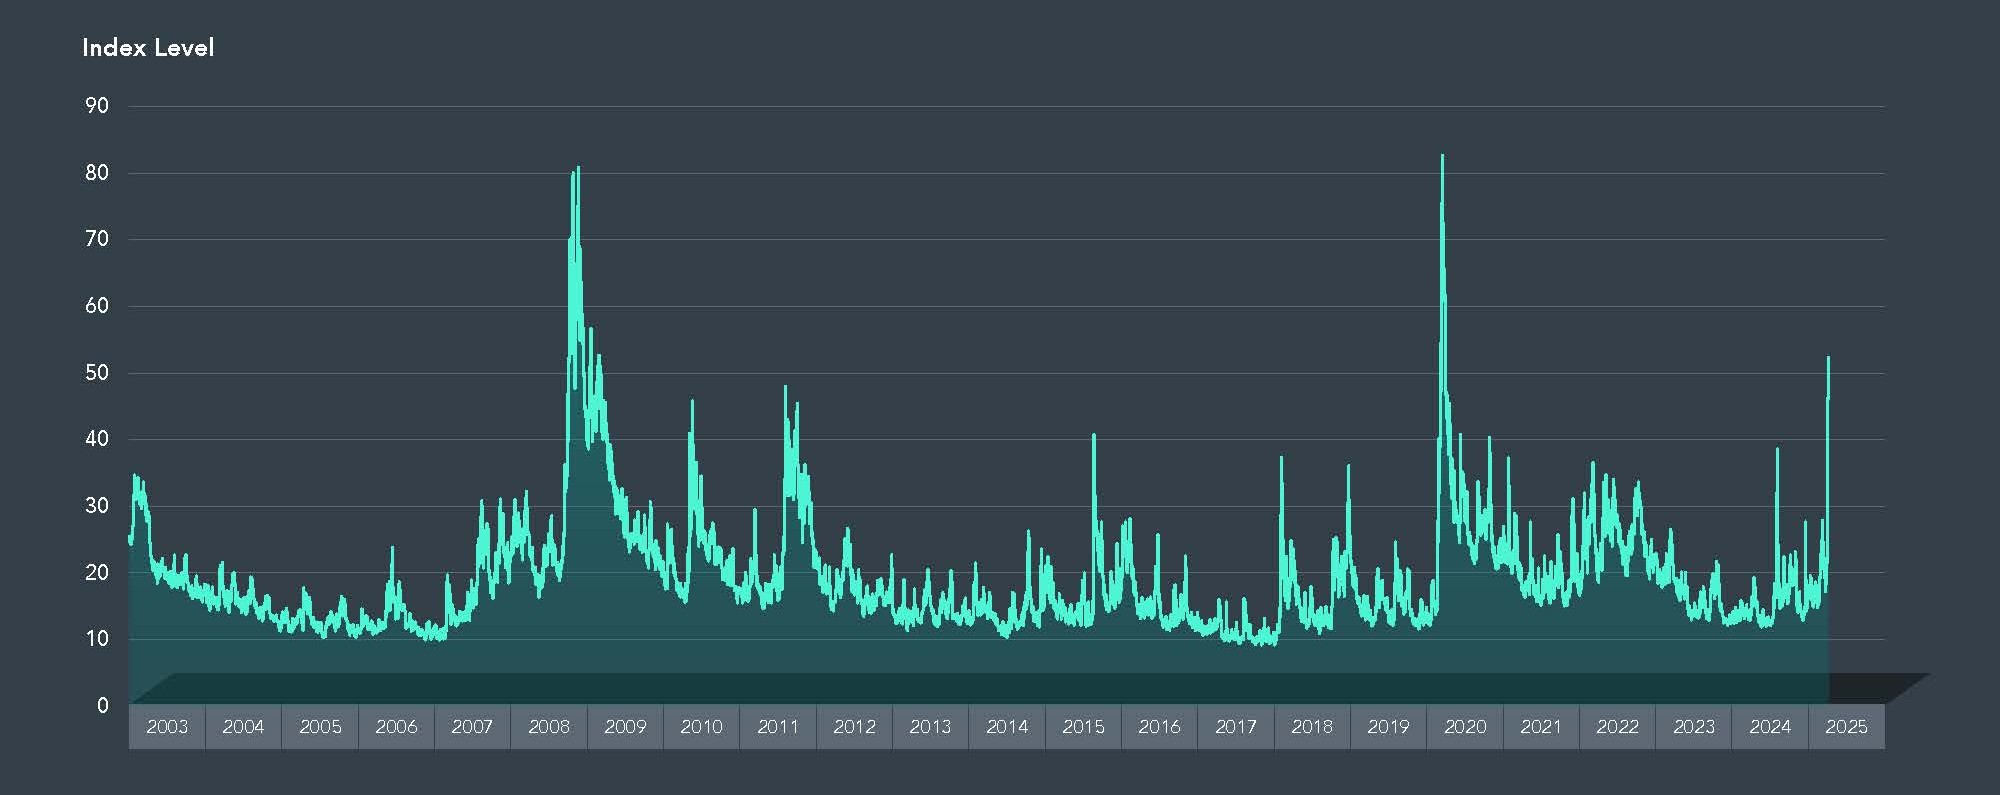
Past performance is no guarantee of future results. In USD. Data from January 1, 2003 to April 8, 2025. Indices are not available for direct investment; therefore, their performance does not reflect the expenses associated with the management of an actual portfolio. The VIX Index is a calculation designed to produce a measure of constant, 30-day expected volatility of the U.S. stock market, derived from real-time, mid-quote prices of S&P 500® Index (SPX℠) call and put options. Source: Chicago Board Options Exchange.
Intra-Year Gains and Declines Vs. Calendar Year Returns
Declines of more than 10% within a year are more common than we think. A decline of this magnitude is unsettling for many, but is in fact quite ‘normal’ for equities. The chart below shows the highest and lowest points of the Russell 3000 Index (a capitalisation-weighted stock market index that seeks to be a benchmark of the entire U.S. stock market) for each calendar year and the actual return (yellow dot).
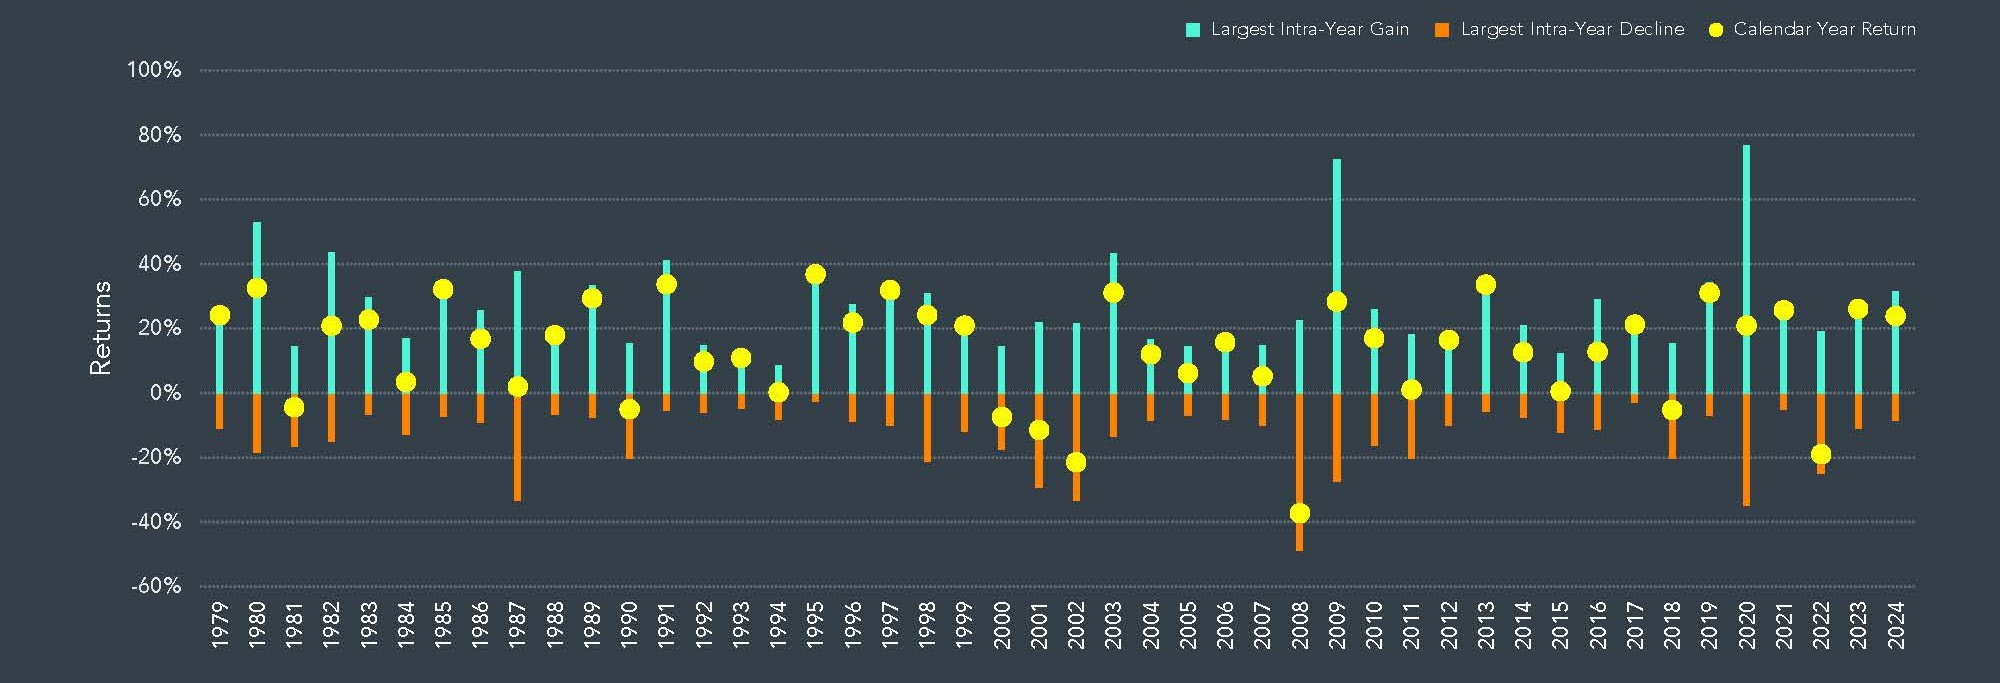
Past performance is no guarantee of future results. Indices are not available for direct investment; therefore, their performance does not reflect the expenses associated with the management of an actual portfolio. In USD. Data is calculated off rounded daily returns. US Market is the Russell 3000 Index. Largest Intra-Year Gain refers to the largest market increase from trough to peak during the year. Largest Intra-Year Decline refers to the largest market decrease from peak to trough during the year. Frank Russell Company is the source and owner of the trademarks, service marks, and copyrights related to the Russell Indexes.
Global Market Overview – January 1 – March 31 2025
Global markets began the year strongly, and this trend continued throughout the first quarter in the UK. Outside of the UK, news of a Chinese AI competitor, DeepSeek, took its toll on some of the US mega stocks before President Trump’s announcement about tariffs.
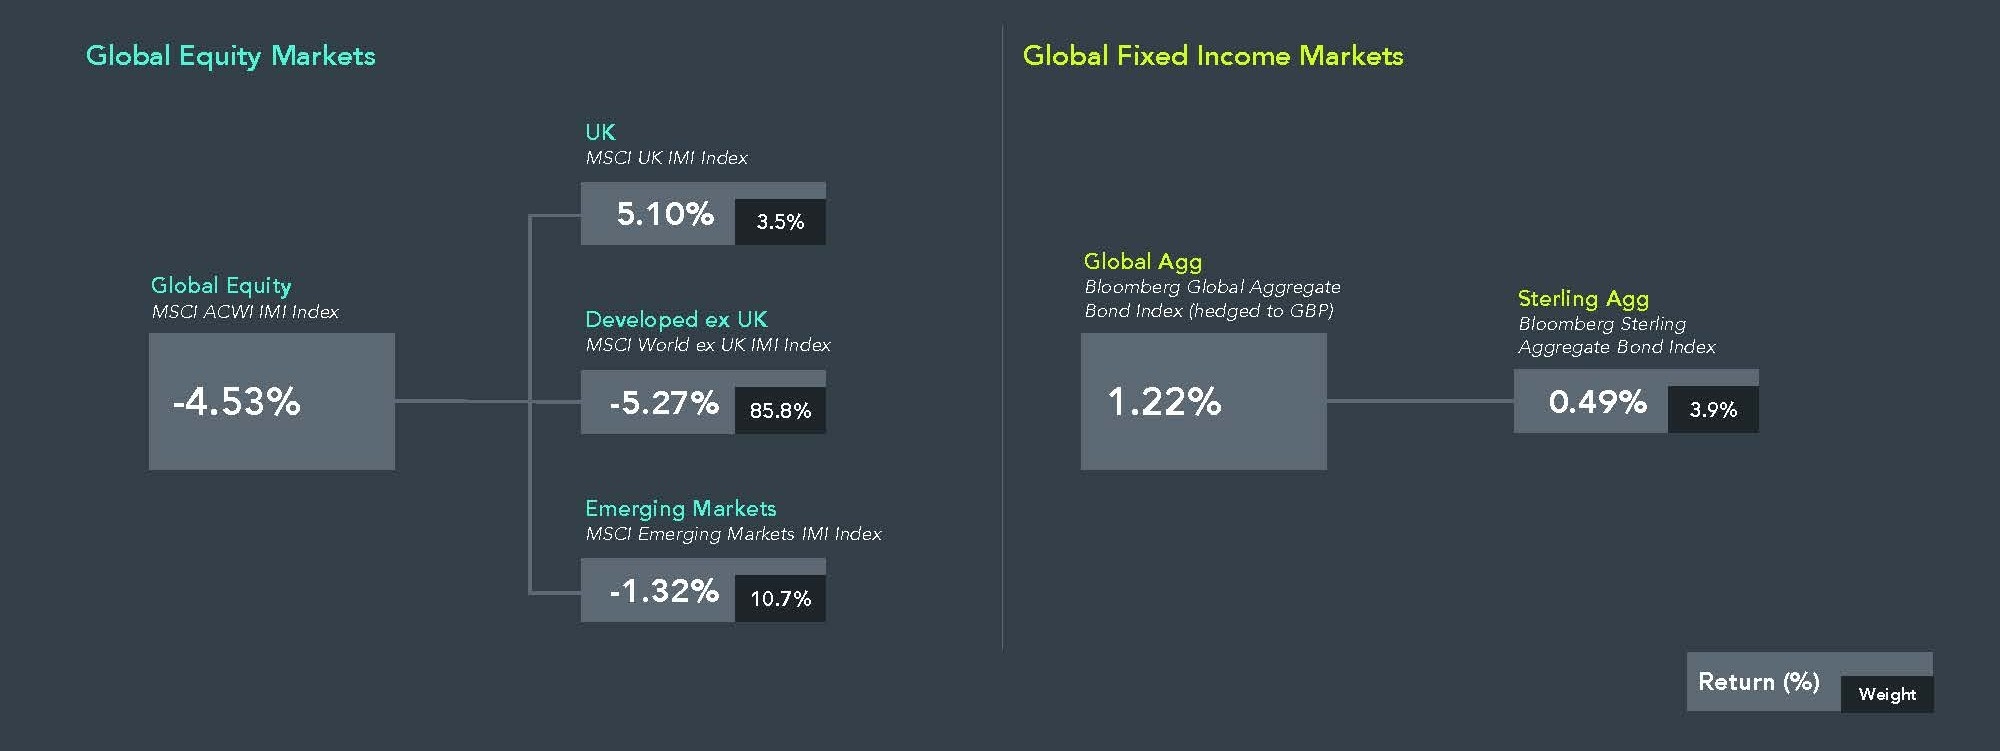
Past performance is no guarantee of future results. Market returns are derived from the stated index. MSCI indices include net dividends. Market weights are based on end of period weights from the MSCI All Country World IMI Index and Bloomberg Global Aggregate Bond Index and Dimensional classification of securities based on region and country of risk. MSCI data © MSCI 2025, all rights reserved. Bloomberg data provided by Bloomberg. Indices are not available for direct investment. Index performance does not reflect the expenses associated with the management of an actual portfolio.
Country Returns
Much of Europe had the strongest returns in quarter 1:
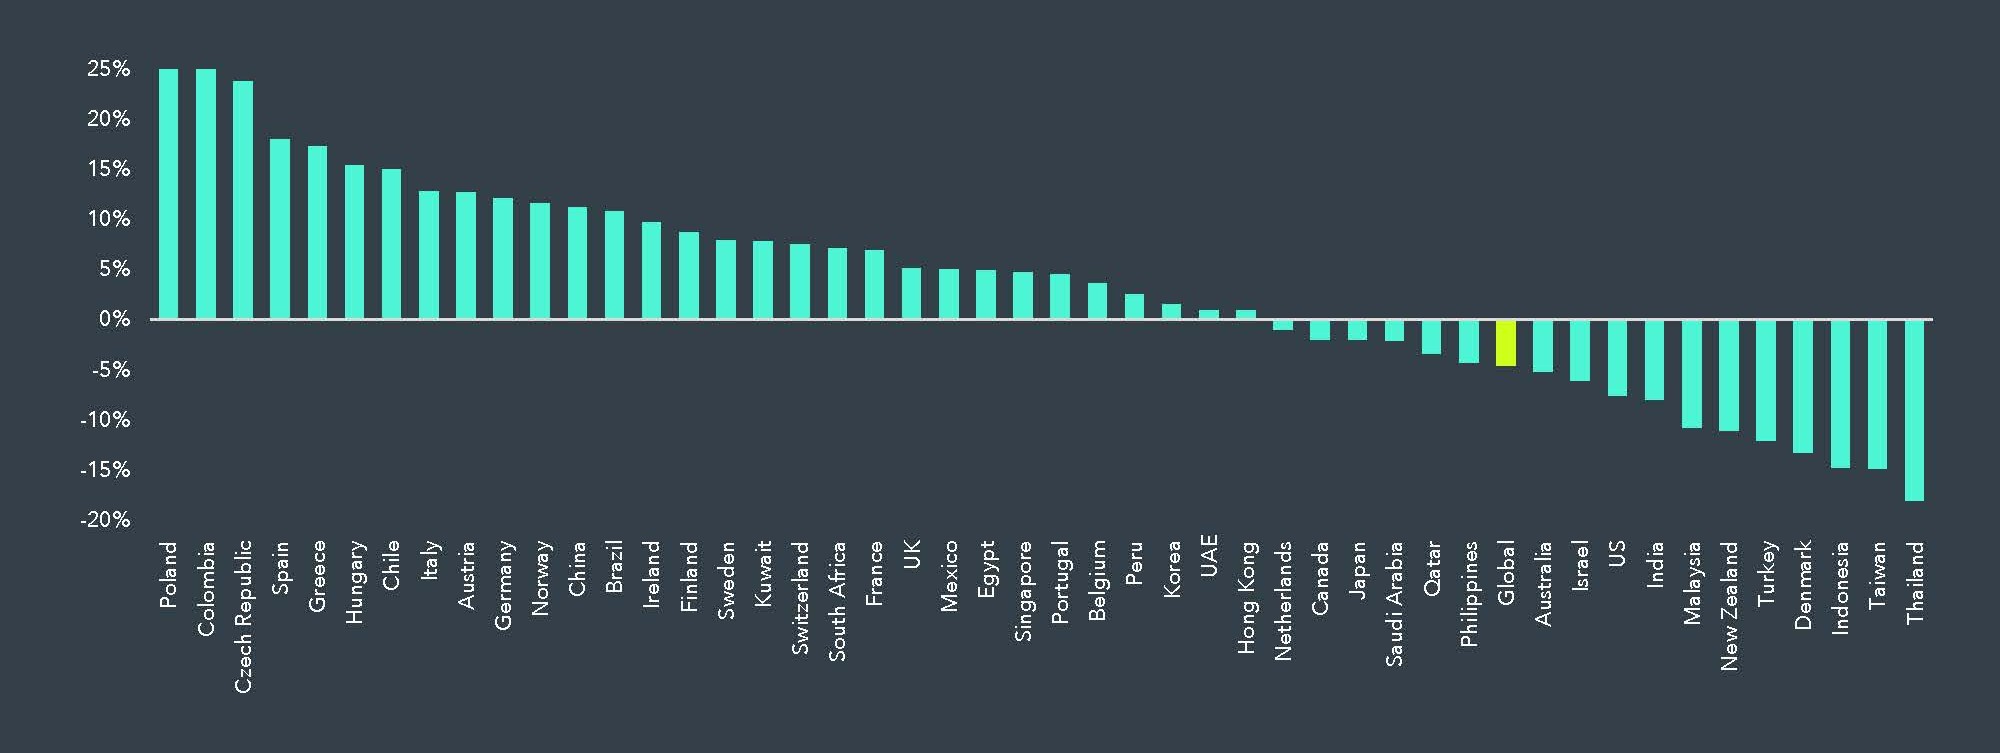
Past performance is no guarantee of future results. Country returns are the country component indices of the MSCI All Country World IMI Index for all countries except the United States, where the Russell 3000 Index is used instead. Global is the return of the MSCI All Country World IMI Index. MSCI index returns are net dividend. Indices are not available for direct investment. Their performance does not reflect the expenses associated with the management of an actual portfolio. Frank Russell Company is the source and owner of the trademarks, service marks and copyrights related to the Russell Indexes. MSCI data © MSCI 2025, all rights reserved.
Sector Returns
The UK’s core sectors showed strong returns, and evidence that sectors around the globe are not always correlated, strengthening the case for diversification.
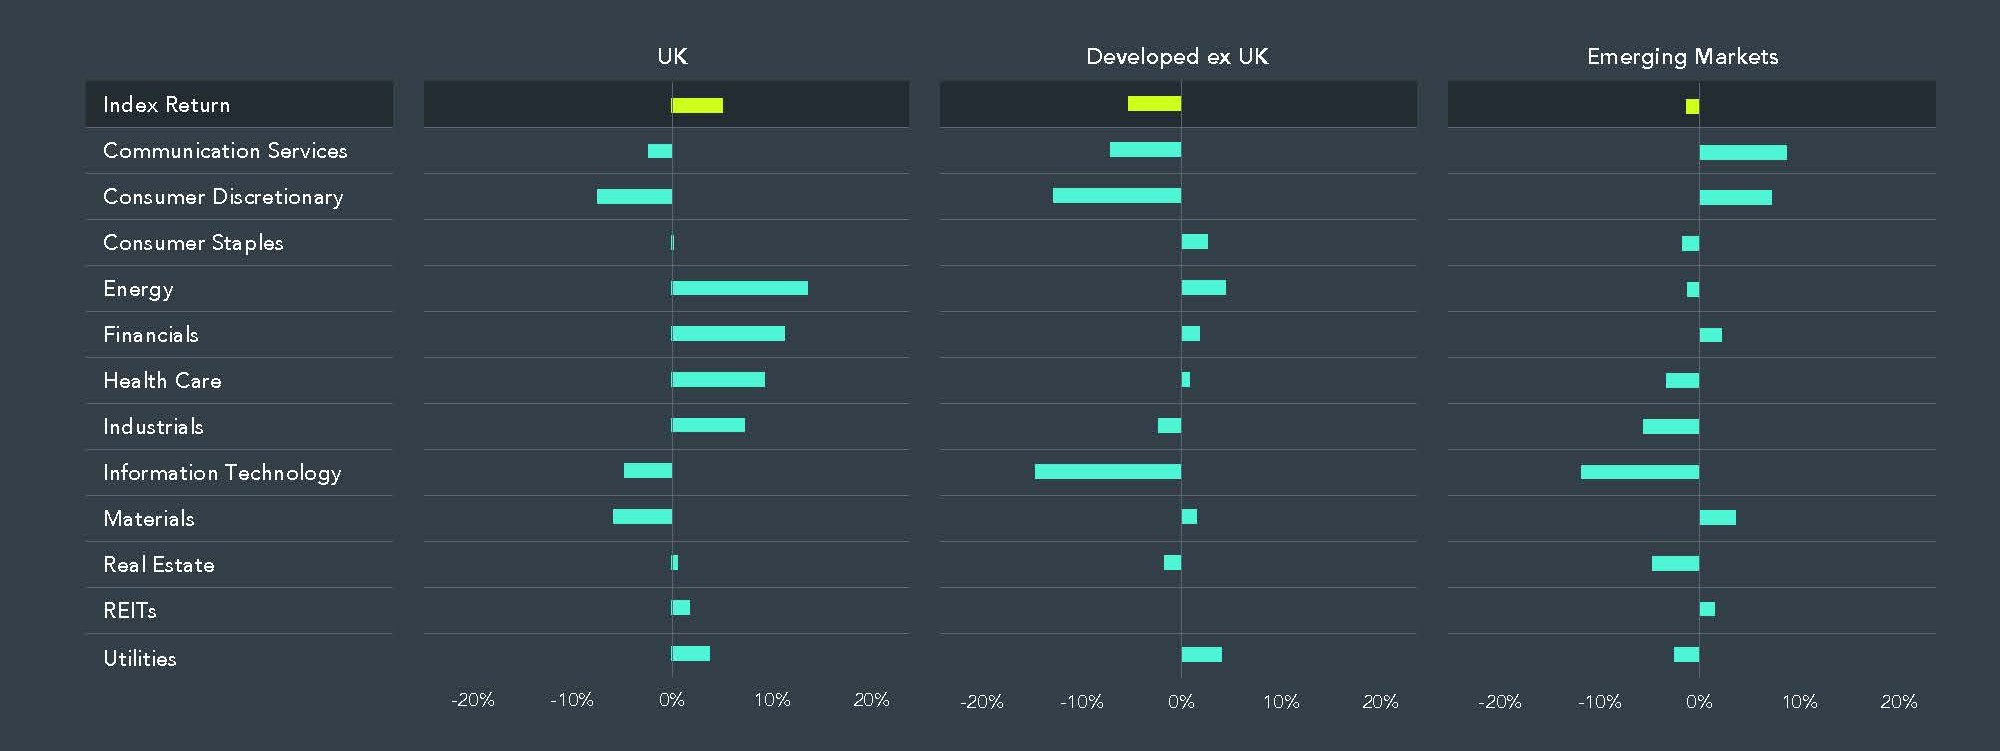
Past performance is no guarantee of future results. Sector returns are derived by Dimensional using constituent data from index providers. Index representation as follows: United Kingdom (MSCI United Kingdom IMI Index), Developed ex UK (MSCI World ex UK IMI Index), and Emerging Markets (MSCI Emerging Markets IMI Index). MSCI index returns are net dividend. Securities without a GICS sector are excluded. GICS was developed by and is the exclusive property of MSCI and S&P Dow Jones Indices LLC, a division of S&P Global. Indices are not available for direct investment. Their performance does not reflect the expenses associated with the management of an actual portfolio. MSCI data © MSCI 2025, all rights reserved.
We now turn our attention to how securities with higher expected returns have performed during the past quarter in developed markets, the UK, and emerging markets.
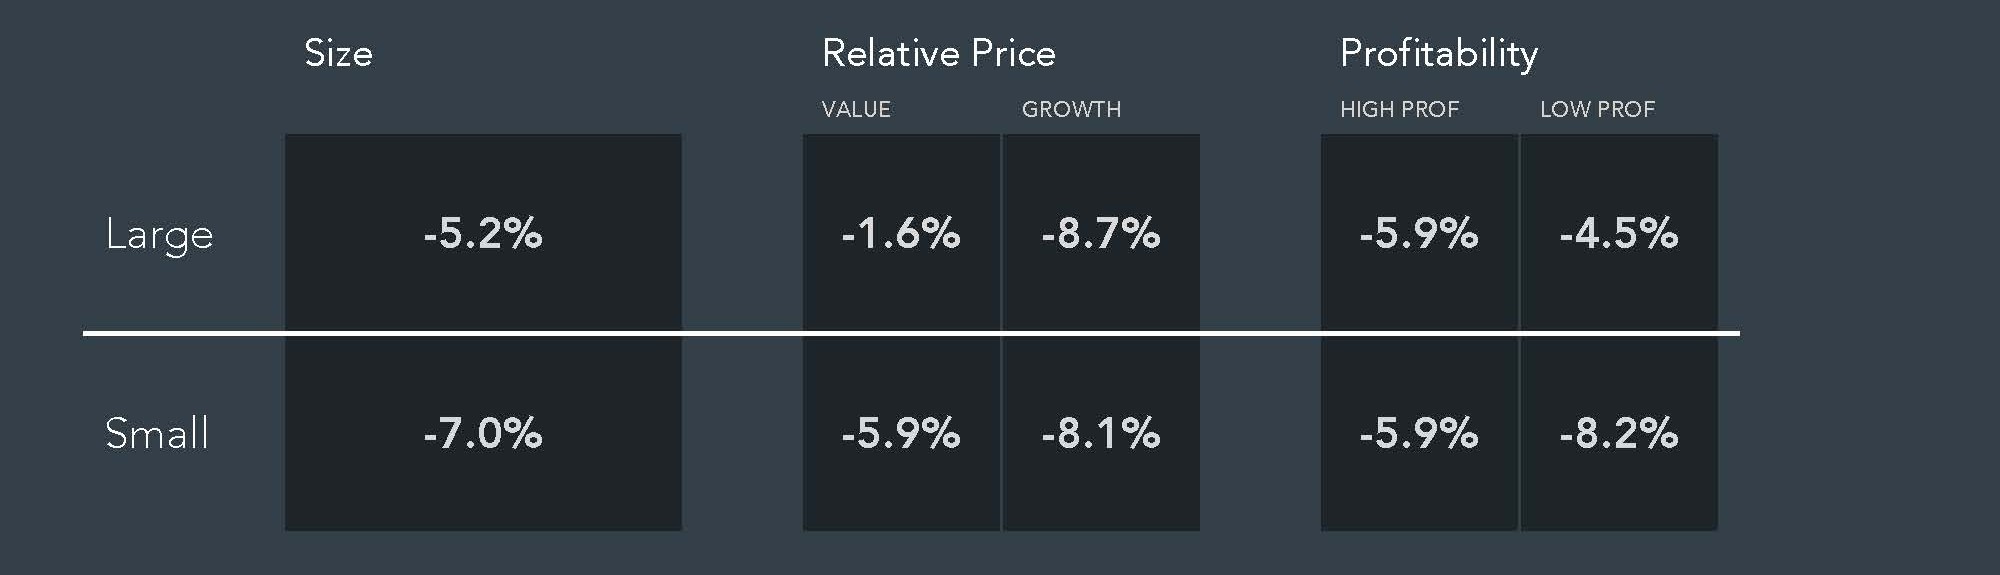
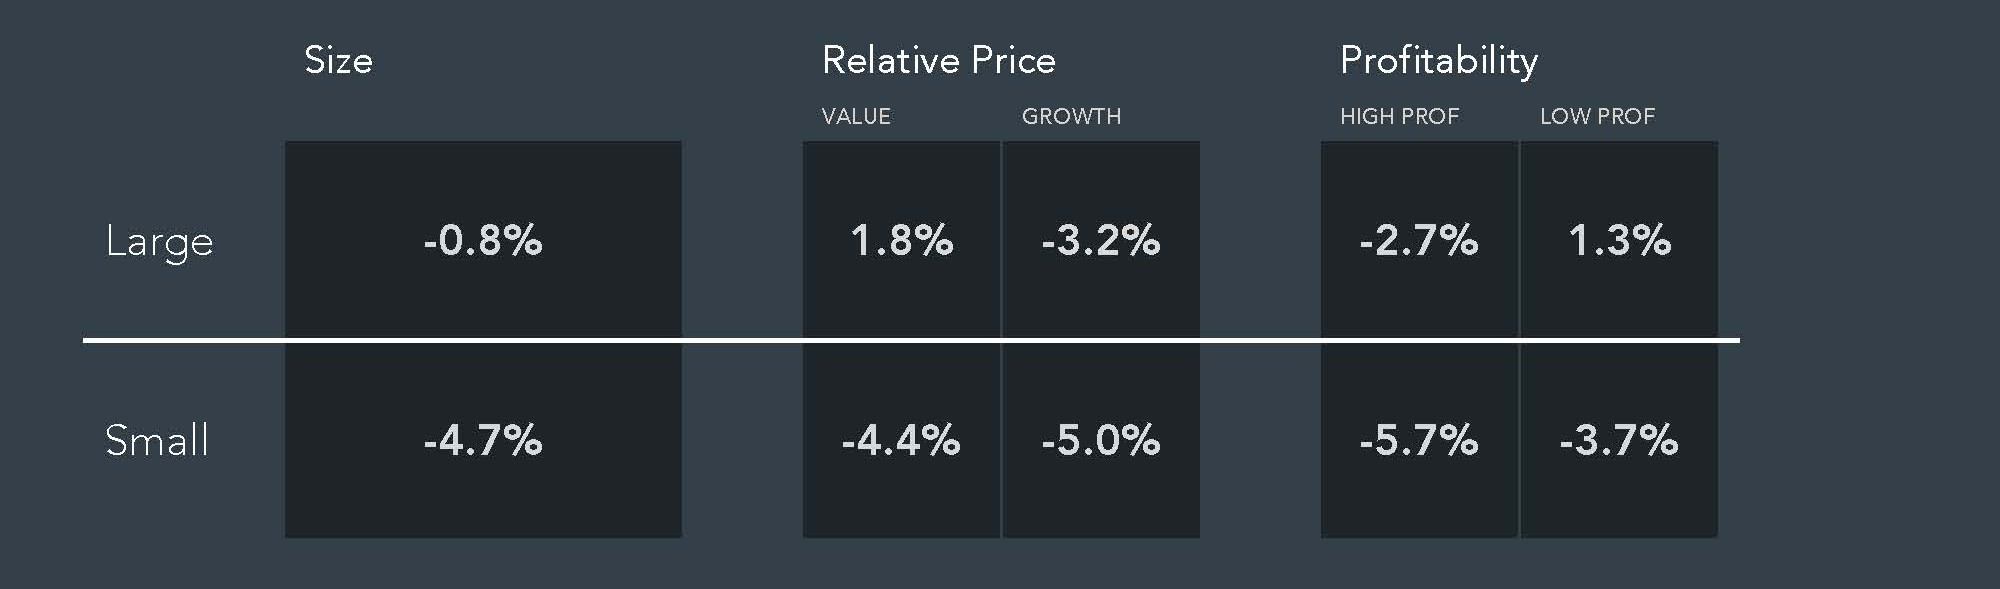
Developed Market Returns (excluding UK):
- Large caps outperformed Small caps
- Value stocks outperformed Growth stocks within both Small and Large caps
- Small High Profitability companies outperformed Small Low Profitability companies
- Large High Profitability companies underperformed Large Low Profitability companies
Past performance is no guarantee of future results. Market returns are computed from MSCI Emerging Markets IMI Index published security weights and Dimensional computed security returns. Within the US, Large Cap is defined as approximately the largest 90% of market capitalisation in each country or region; Small Cap is approximately the smallest 10%. Within the non-US developed markets, Large Cap is defined as approximately the largest 87.5% of market capitalisation in each country or region; Small Cap is approximately the smallest 12.5%. Within emerging markets, Large Cap is defined as approximately the largest 85% of market capitalisation in each country or region; Small Cap is approximately the smallest 15%. Designations between value and growth are based on price to book ratios. Value is defined as the 50% of market cap with the lowest price to book ratios by size category and growth is the highest 50%. Profitability is measured as operating income before depreciation and amortisation minus interest expense scaled by book. High profitability is defined as the 50% of market cap with the highest profitability by size category and low profitability is the lowest 50%. REITs and utilities, identified by GICS code, and stocks without size, relative price, or profitability metrics are excluded from this analysis. GICS was developed by and is the exclusive property of MSCI and S&P Dow Jones Indices LLC, a division of S&P Global. Countries not in the Dimensional investable universe are excluded from the analysis. Indices are not available for direct investment. Their performance does not reflect the expenses associated with the management of an actual portfolio. MSCI data © MSCI 2025, all rights reserved.
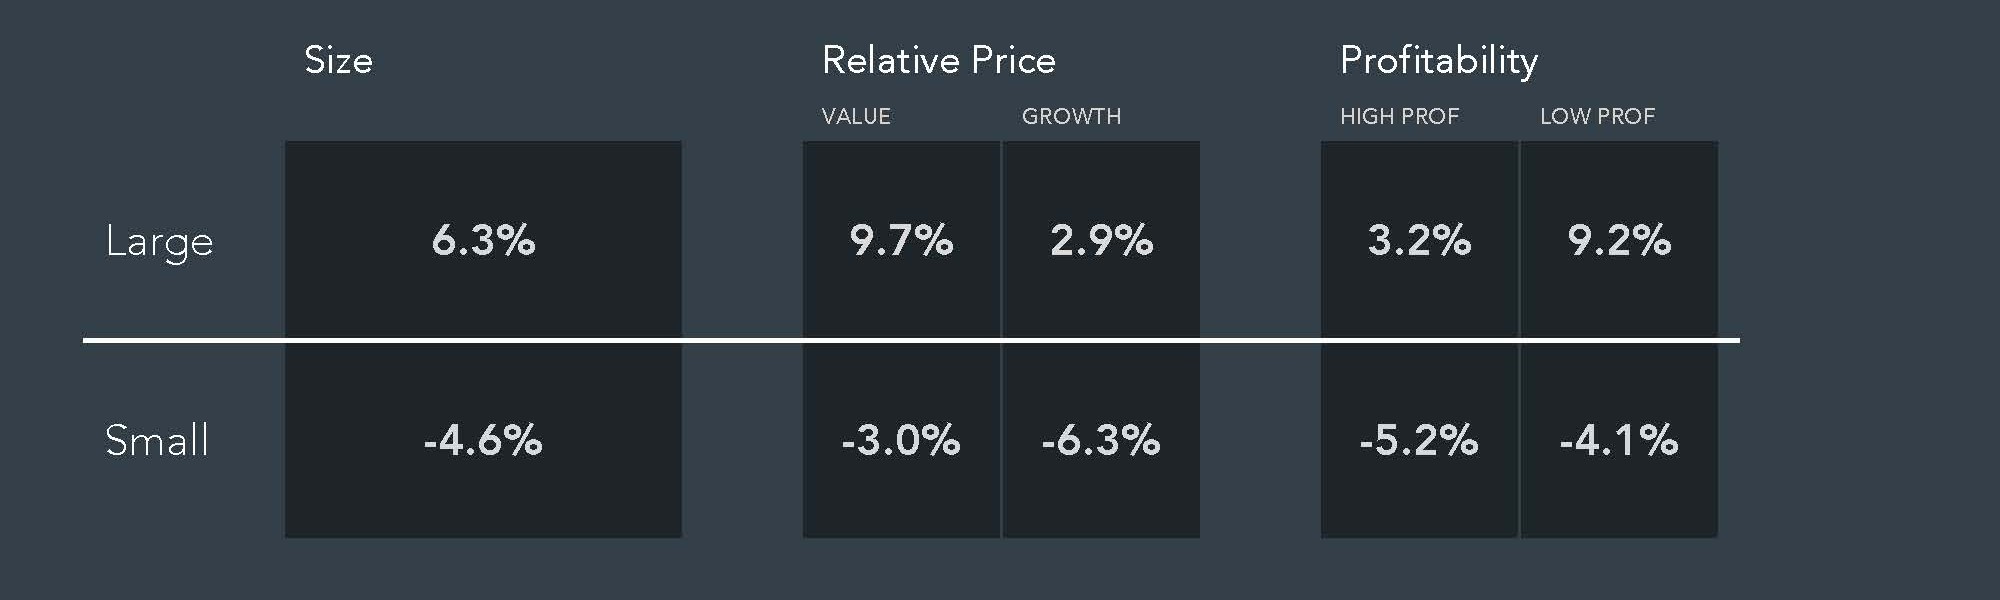
UK Market Returns:
- Large caps outperformed Small caps
- Value stocks outperformed Growth stocks
- High Profitability stocks underperformed Low Profitability stocks
Past performance is no guarantee of future results. Market returns are computed from MSCI United Kingdom IMI Index published security weights and Dimensional computed security returns. Within the US, Large Cap is defined as approximately the largest 90% of market capitalisation in each country or region; Small Cap is approximately the smallest 10%. Within the non-US developed markets, Large Cap is defined as approximately the largest 87.5% of market capitalisation in each country or region; Small Cap is approximately the smallest 12.5%. Within emerging markets, Large Cap is defined as approximately the largest 85% of market capitalisation in each country or region; Small Cap is approximately the smallest 15%. Designations between value and growth are based on price to book ratios. Value is defined as the 50% of market cap with the lowest price to book ratios by size category and growth is the highest 50%. Profitability is measured as operating income before depreciation and amortisation minus interest expense scaled by book. High profitability is defined as the 50% of market cap with the highest profitability by size category and low profitability is the lowest 50%. REITs and utilities, identified by GICS code, and stocks without size, relative price, or profitability metrics are excluded from this analysis. GICS was developed by and is the exclusive property of MSCI and S&P Dow Jones Indices LLC, a division of S&P Global. Countries not in the Dimensional investable universe are excluded from the analysis. Indices are not available for direct investment. Their performance does not reflect the expenses associated with the management of an actual portfolio. MSCI data © MSCI 2025, all rights reserved.
Emerging Market Returns:
- Large caps outperformed Small caps
- Value stocks outperformed Growth stocks
- Low Profitability stocks outperformed High Profitability stocks
Past performance is no guarantee of future results. Market returns are computed from MSCI Emerging Markets IMI Index published security weights and Dimensional computed security returns. Within the US, Large Cap is defined as approximately the largest 90% of market capitalisation in each country or region; Small Cap is approximately the smallest 10%. Within the non-US developed markets, Large Cap is defined as approximately the largest 87.5% of market capitalisation in each country or region; Small Cap is approximately the smallest 12.5%. Within emerging markets, Large Cap is defined as approximately the largest 85% of market capitalisation in each country or region; Small Cap is approximately the smallest 15%. Designations between value and growth are based on price to book ratios. Value is defined as the 50% of market cap with the lowest price to book ratios by size category and growth is the highest 50%. Profitability is measured as operating income before depreciation and amortisation minus interest expense scaled by book. High profitability is defined as the 50% of market cap with the highest profitability by size category and low profitability is the lowest 50%. REITs and utilities, identified by GICS code, and stocks without size, relative price, or profitability metrics are excluded from this analysis. GICS was developed by and is the exclusive property of MSCI and S&P Dow Jones Indices LLC, a division of S&P Global. Countries not in the Dimensional investable universe are excluded from the analysis. Indices are not available for direct investment. Their performance does not reflect the expenses associated with the management of an actual portfolio. MSCI data © MSCI 2025, all rights reserved.
Market Have Rewarded Discipline
Tune out the noise, stay seated, and markets will reward you.
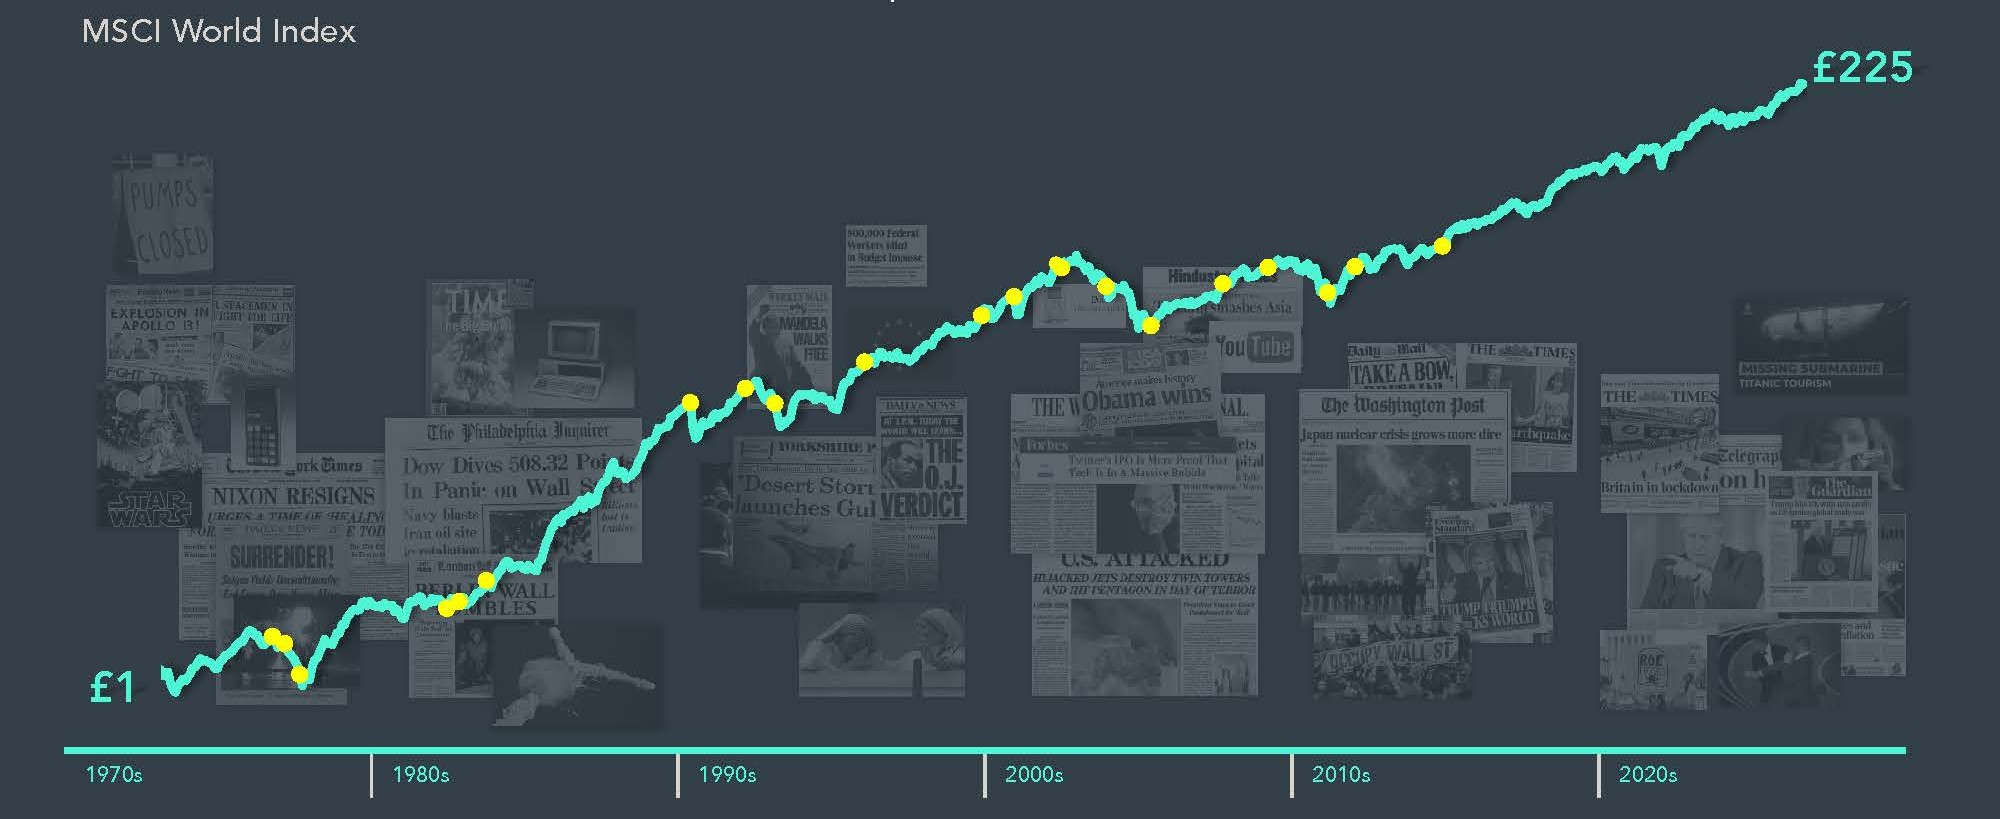
Past performance (including hypothetical past performance) does not guarantee future or actual results. In GBP. Data presented in the Growth of £1 chart is hypothetical and assumes reinvestment of income and no transaction costs or taxes. The chart is for illustrative purposes only and is not indicative of any investment. Performance may increase or decrease as a result of currency fluctuations. These events are not offered to explain market returns. Instead, they serve as a reminder that investors should view daily events from a long-term perspective and avoid making investment decisions based solely on the news. MSCI data © MSCI 2025, all rights reserved. Indices are not available for direct investment; therefore, their performance does not reflect the expenses associated with the management of an actual portfolio.
Please contact us if you have any questions about the Dimensional investment service.
Approved by Best Practice IFA Group Limited on 28/04/2025.